

Learn More
Pricing
Based on big data from the platform's testing, Tencent WeTest provides an in-depth analysis of mobile compatibility issues in 2021 across dimensions such as RAM, GPU, Operating System, and App/Game categories.
With the rapid development of mobile internet technology, mobile applications are being widely used in various fields, becoming crucial carriers for corporate digital business. However, as the user base grows, device fragmentation has intensified. This is characterized by a vast array of brands, models, system versions, and screen resolutions. Developers face enormous challenges in ensuring a good user experience across these diverse environments, making compatibility testing an essential part of quality assurance.
Android compatibility issues can be categorized into 8 types (see chart below).
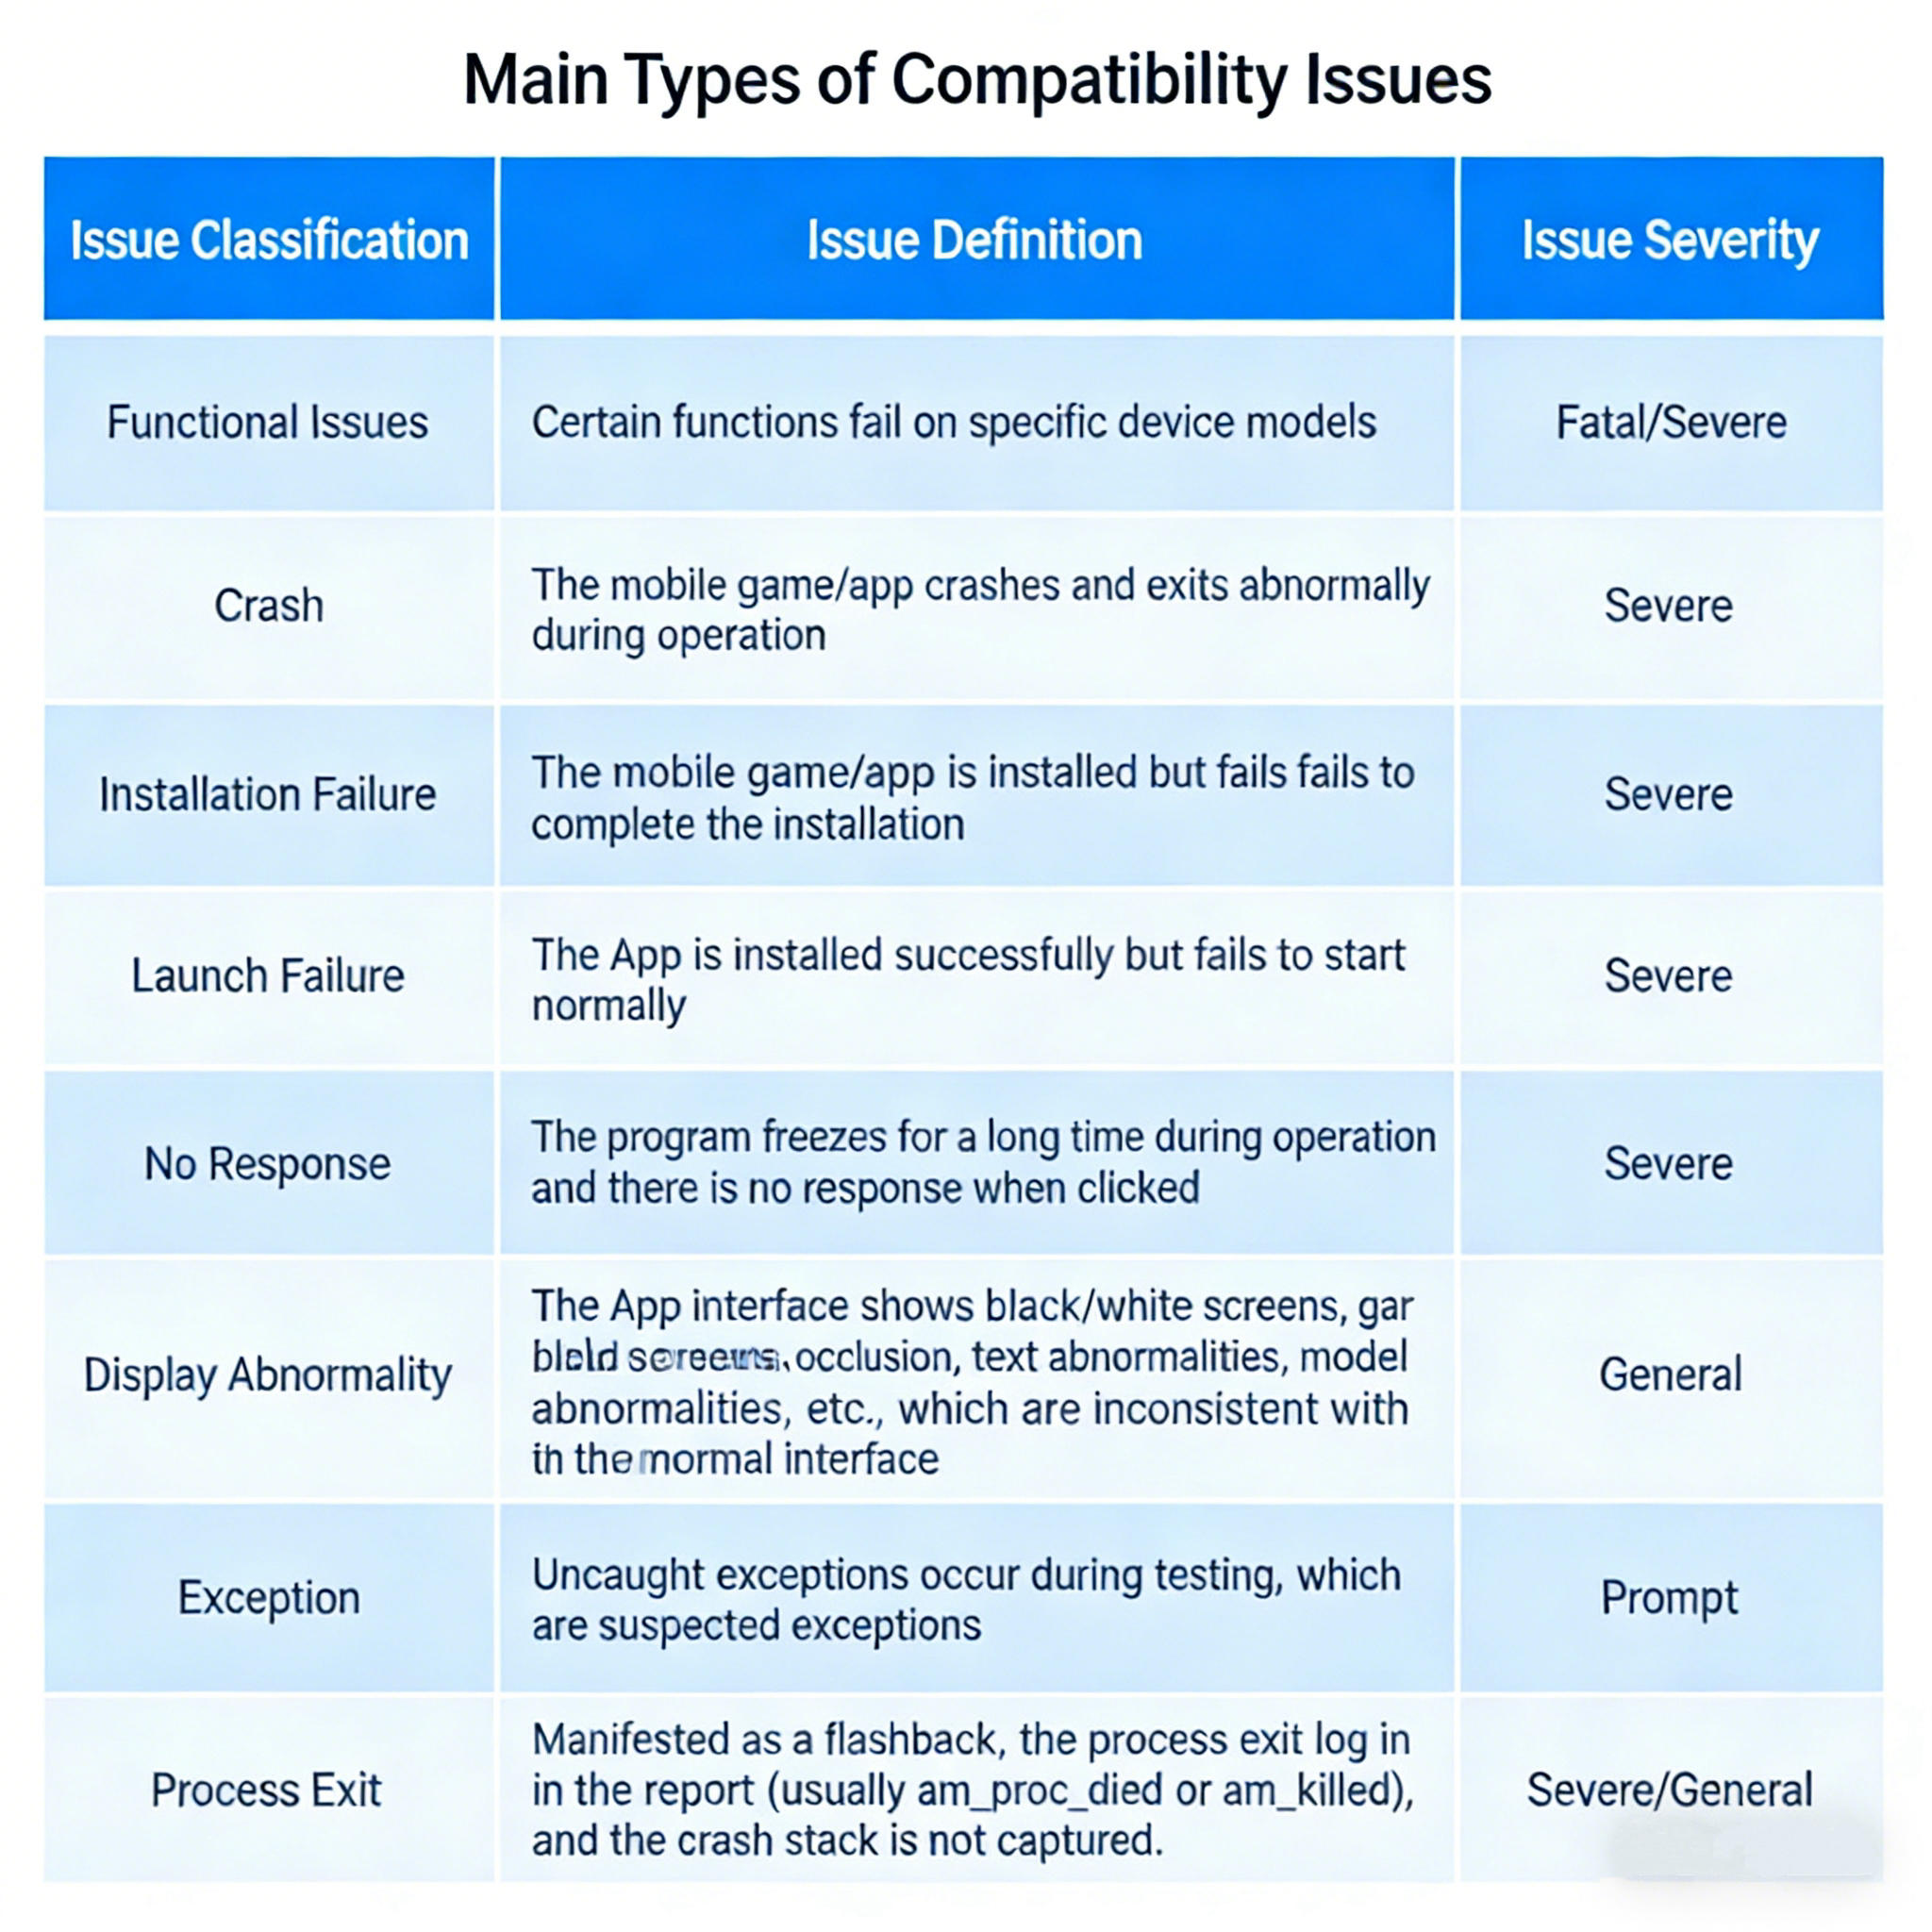
Testing data shows an average of 12.1 issues detected per compatibility test. The most prominent problems are Display Abnormalities (33.25%), Functional Issues (30%), and Process Exits/Crashes (20.68%), which together account for 83.92% of all compatibility issues. Display abnormalities are ubiquitous and include issues related to non-standard screens (notches/punch-holes), content not filling the screen, UI glitches, and button errors.
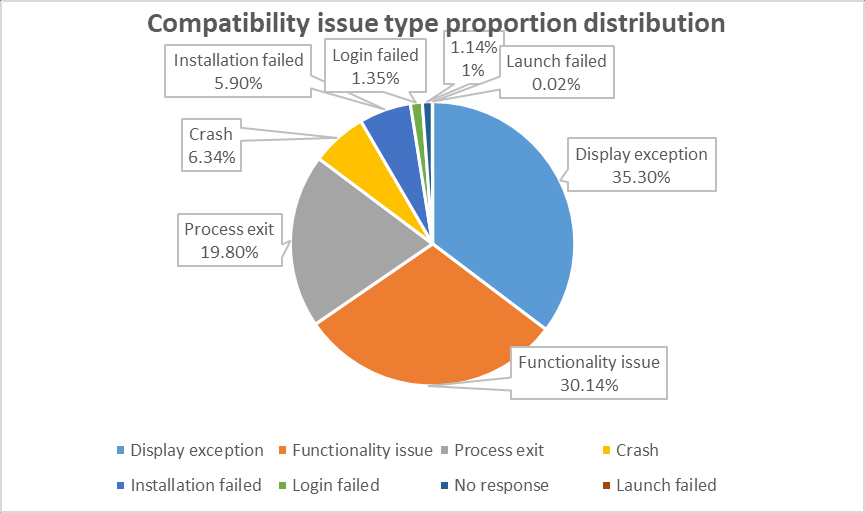
(Chart 1: Distribution of Compatibility Issue Types)
Generally, the higher the device memory, the lower the probability of Crashes, Installation Failures, and "App Not Responding" (ANR) errors. However, higher memory devices show a higher proportion of Display Abnormalities. For instance, on devices with 8GB–12GB of RAM, the crash rate is only 0.38%, but display abnormalities account for a staggering 64.4%.
Among new models launched in 2021, non-standard screens (heterogeneous screens) account for approximately 94.2%. Common adaptation issues include:
Interfaces not filling the screen (black bars).
Interfaces being obscured by the camera hole.
Corner content being cut off by rounded screen edges.
Failure to adapt to single punch-hole screens.
Developers should focus heavily on these areas.
Additionally, devices with 3GB RAM or less now cover only about 6.0% of the market. Developers may consider whether it is cost-effective to continue supporting these low-memory devices.
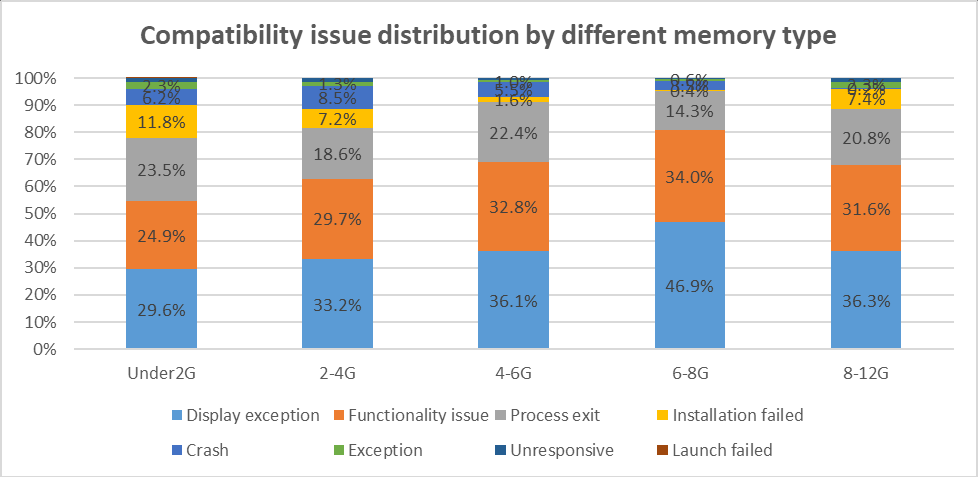
(Chart 2: Distribution of Compatibility Issues by RAM)
Regarding GPU compatibility, the higher the user coverage of a GPU, the lower the test failure rate tends to be.
Adreno 650: Highest coverage (8.2%), with a failure rate of only 4.0%.
Mali-G76MP16: Lowest coverage among the sample (3.0%), with a failure rate of 6.0%.
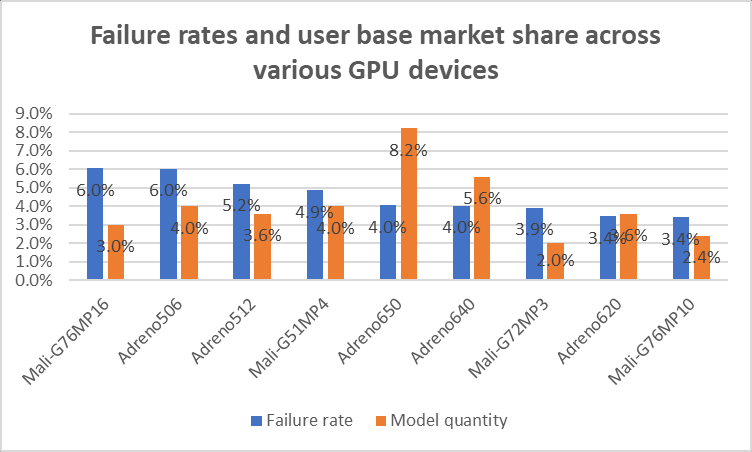
(Chart 3: Device Failure Rate & Market Coverage by GPU)
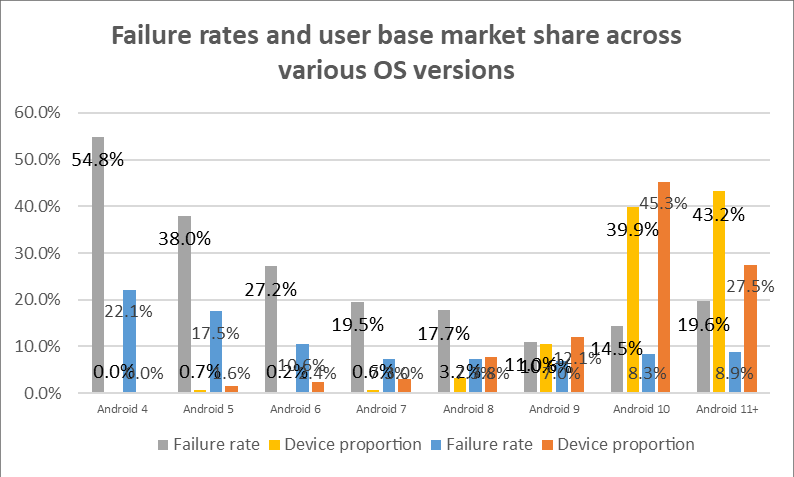
On average, 9.2 issues are found per test across different Android versions.
Android 10 and above: High user coverage of 72.8%, with a failure rate of 17.2%. Display abnormalities, functional issues, and process exits are relatively high. Developers should focus on adapting for these devices, checking for issues like non-standard screen support, icon occlusion, and text overflow.
Android 4, 5, 6: These legacy systems have high rates of display and functional issues. However, their combined user coverage is only 4%. Developers should weigh the costs of adapting for these lower-version systems.
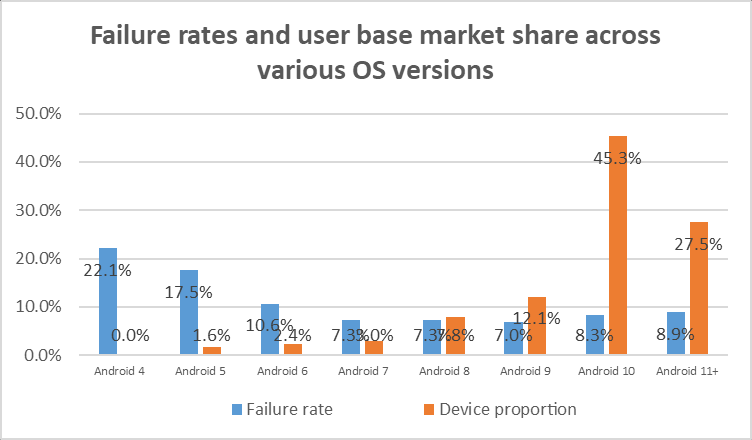
(Chart 4: Failure Rate & Market Coverage by System Version)
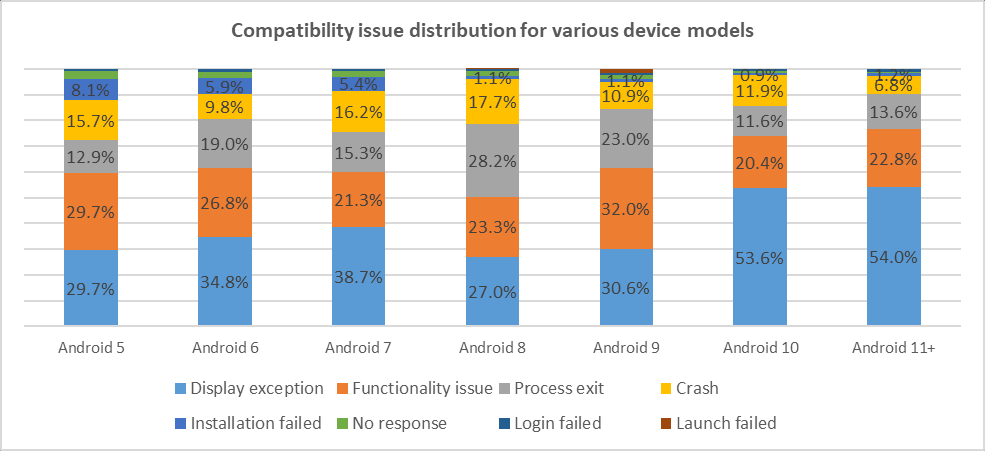
(Chart 5: Compatibility Issue Distribution by System Version)
On average, 7.8 issues are found per test across iOS devices. Functional issues and display abnormalities are the most frequent, including unresponsive clicks, freezing, screen glitches, occlusion, and overlapping elements.
iOS 15 Series: As the latest system, it has a user coverage of 43.2% and a device failure rate of 19.6%. Common issues remain functional and display-related, warranting close attention.
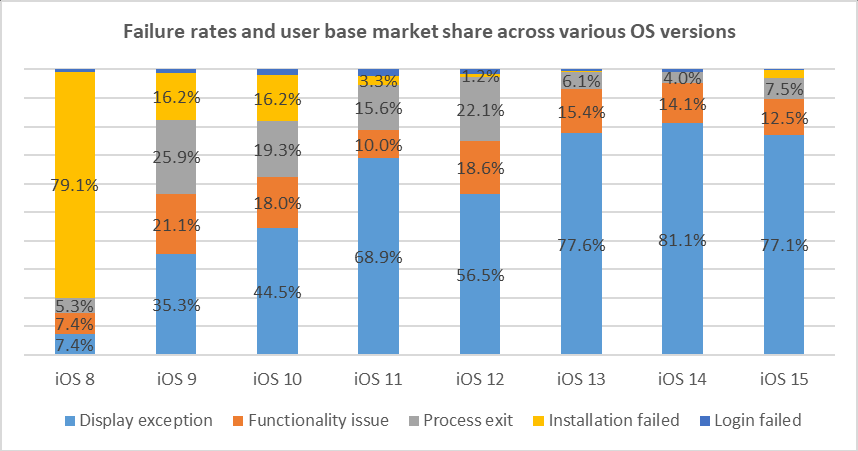
(Chart 6: Device Failure Rate & Market Coverage)
(Chart 7: Compatibility Issue Distribution by System Version)
Chat/Communication: Display abnormalities are most frequent (66.3%).
Games: Display abnormalities are also dominant (64.2%).
Finance: Functional issues are the most common (43.1%).
Tools: Process exits and installation failures occur more often here (29.4%).
Entertainment: Crash issues are more prevalent.
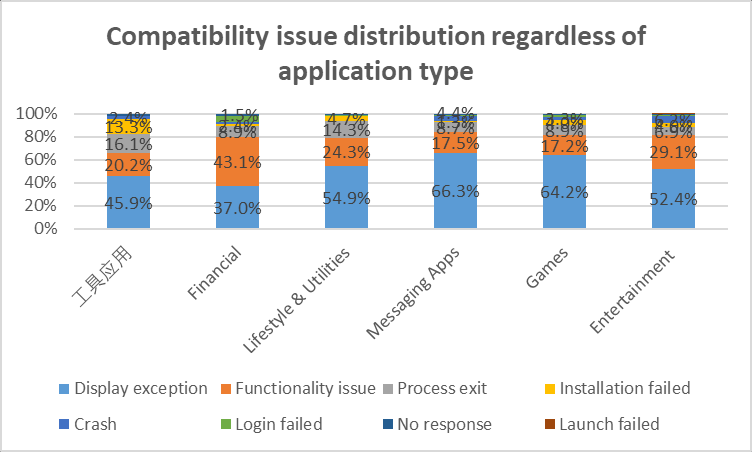
(Chart 8: Compatibility Issue Distribution by App Type)
Display Abnormalities: Most common in Sports (79.36%), Puzzle/Casual (72.21%), and Strategy/RPG (66.22%) games.
Adventure Games: More prone to Functional Issues (26.32%) and Crashes (10.99%) compared to other genres.
Strategy/War Games: More susceptible to Process Exits (10.91%) than other types.
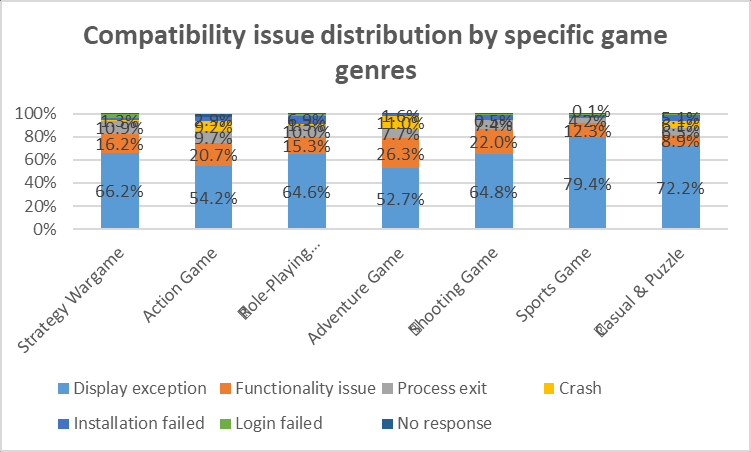
(Chart 9: Compatibility Issue Distribution by Specific Game Genre)
Overall, mobile application compatibility issues in 2021 remained concentrated in Display Abnormalities, Functional Issues, and Process Exits.
Notably, display abnormalities are widespread across all device types and applications. Given the dominant trend of non-standard screens (notches, punch-holes, rounded corners) in recent years, developers must prioritize UI adaptation for these screen types.